| model | r2_tjur | |
|---|---|---|
| Tjur’s R2…1 | PageValues + BounceRates | 31.9% |
| Tjur’s R2…2 | ProductDuration + ExitRates | 7.3% |
| Tjur’s R2…3 | All 4 Predictors | 33.3% |
🧮⚙️ Modeling Purchase Intent: Feature Selection and Interpretation
1 🧪 Comparing Predictors
2 📐 Model Formula
We selected the final model based on the best performance (Tjur’s R²). This model helps explain how different features affect the likelihood of a purchase:
\[ \text{logit}(P(\text{Purchase})) = \beta_0 + \beta_1 \cdot \text{PageValues} + \beta_2 \cdot \text{ProductDuration} + \beta_3 \cdot \text{BounceRates} + \beta_4 \cdot \text{ExitRates} \]
Where:
- \(\text{logit}(P)\) = log odds of making a purchase
PageValues= value of pages visited by the user
ProductDuration= time spent on product-related pages
BounceRates= likelihood user left after landing
ExitRates= rate of exiting from a particular page
- \(\beta_0\)–\(\beta_4\) = model coefficients
| term | Odds_Ratio | CI_low | CI_high |
|---|---|---|---|
| (Intercept) | 0.1362293 | 0.1201786 | 0.1542216 |
| PageValues | 1.0827848 | 1.0779567 | 1.0877652 |
| ProductRelated_Duration | 1.0001316 | 1.0001059 | 1.0001574 |
| ExitRates | 0.0000000 | 0.0000000 | 0.0000008 |
| BounceRates | 0.0712962 | 0.0001122 | 36.1970367 |
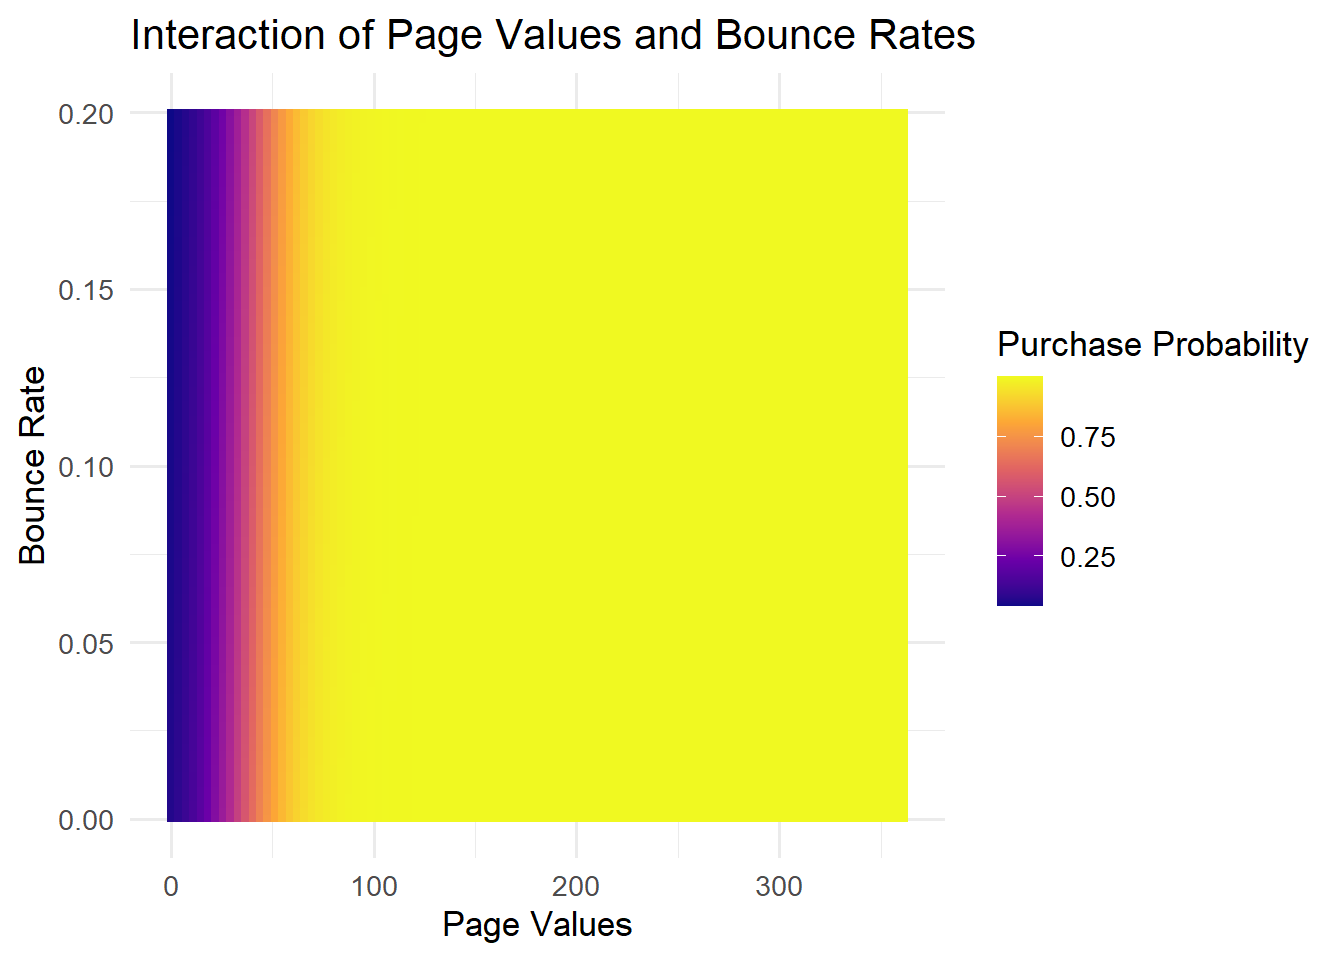
This heatmap shows how Page Values and Bounce Rates together affect the probability of a purchase. Higher Page Values increase purchase chances, especially when Bounce Rates are low. The warmer the color, the higher the predicted probability.
3 📌 Key Takeaways
- PageValues had the strongest positive effect on the chance of purchase.
- BounceRates and ExitRates both reduce the odds of purchase, suggesting user disinterest.
- Visitors who spent more time on product-related pages were more likely to make a purchase.
- The final model gives simple and useful insights that can help improve the website and marketing strategies.